In this technical article, we examine the GBPUSD Elliott Wave charts published in our members’ area. GBPUSD has completed a textbook 5-wave pattern within a cycle that started at the 1.3677 peak. Below, we break down the Elliott Wave structure and examine the near-term outlook for GBPUSD.
For those unfamiliar with common Elliott Wave structures, the Free Educational Page provides a useful reference.
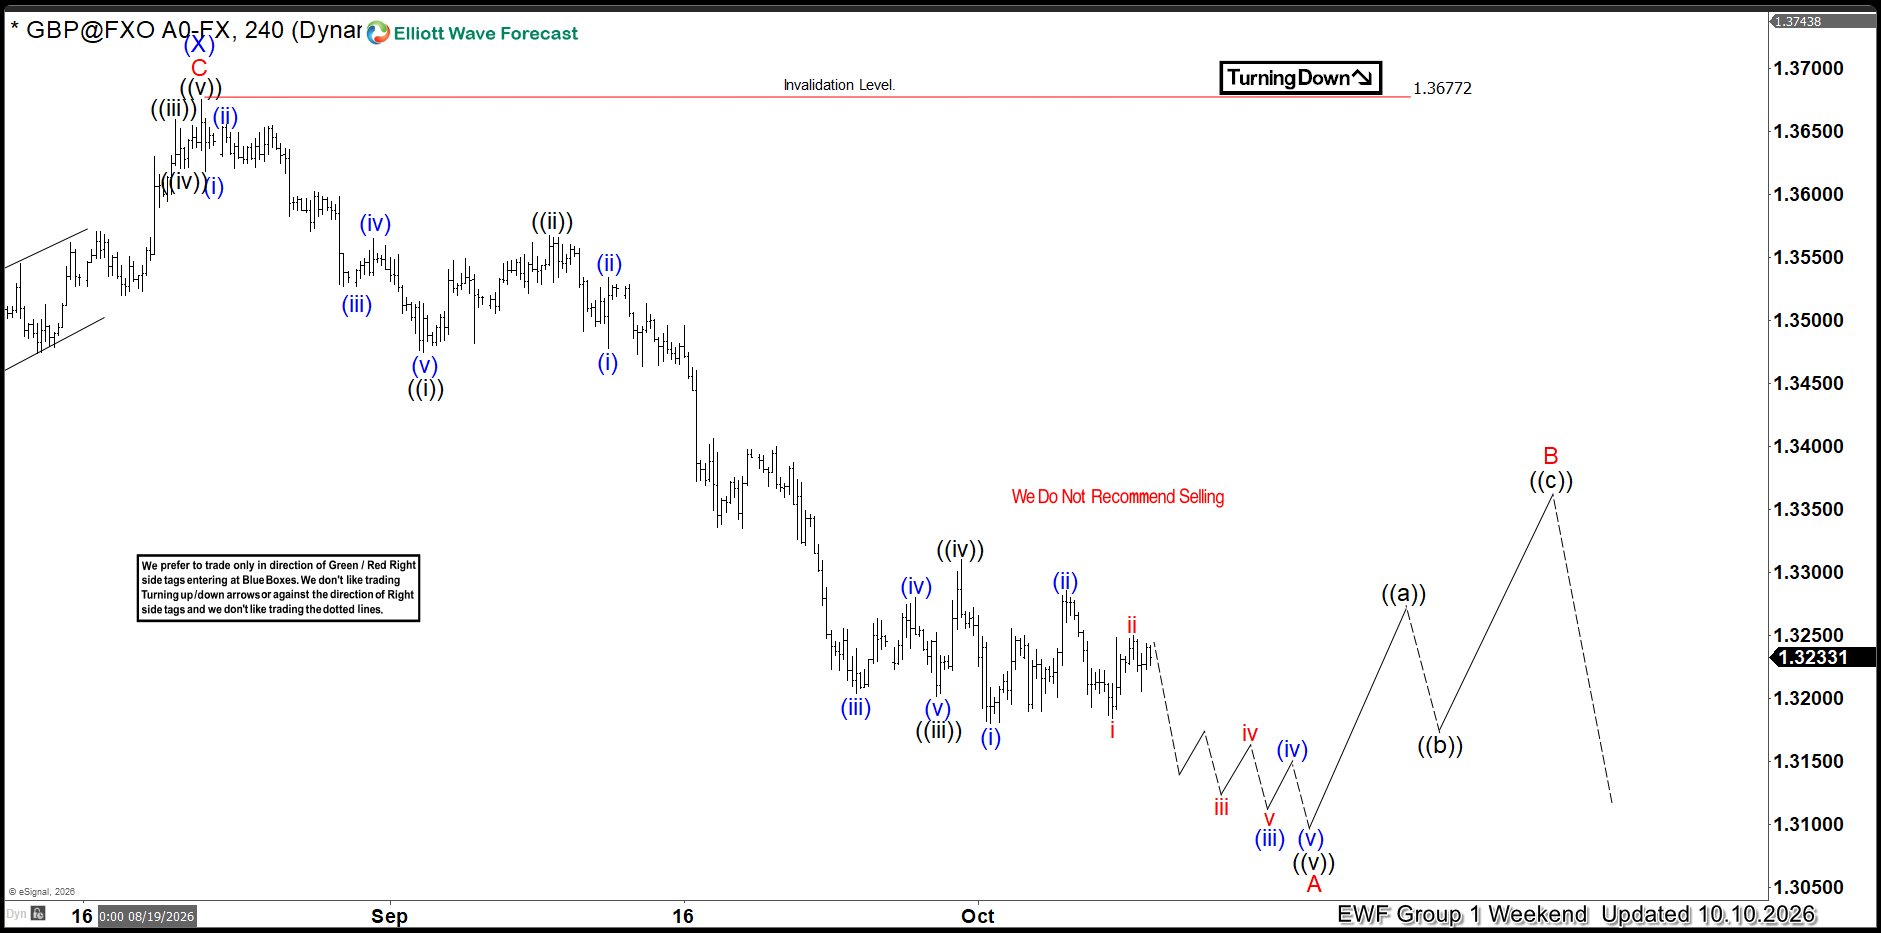
GBPUSD Elliott Wave 4-Hour Chart — 10.10.2026
GBPUSD is forming a 5-wave pattern in the cycle from the 1.3677 peak. The structure suggests an Elliott Wave Double Three pattern, with one more move down needed to complete the 5 waves. At this stage, wave ((iv)) is seen as completed. However, the structure could remain sideways and alternatively develop into a Triangle pattern or form an Expanded Flat before breaking toward new lows. The target for wave ((v)) is obtained by measuring the inverse 123.6%–161.8% extension of wave ((iv)), placing the wave ((v)) target in the 1.3180–1.3140 area.

GBPUSD Elliott Wave 4-Hour Chart — 10.16.2026
GBPUSD remained sideways and made another leg down after completing a Triangle pattern in wave ((iv)). Wave ((v)) reached the target zone and triggered a sharp rally that looks impulsive. The current view suggests that the rally could be the first leg of a larger bounce.
Note: Some labels have been removed from the chart to protect clients’ privacy.

Keep in mind that the market is dynamic and the view presented here may have changed in the meantime. The best instruments to trade are those with incomplete bullish or bearish swing sequences, as the developing structure offers the clearest directional bias and risk definition.