The Indian Rupee (INR) gains against the US Dollar (USD) after a flat opening on Wednesday. The USD/INR pair falls to near 95.84 as the Indian currency has drawn temporary support from consistent Reserve Bank of India (RBI) intervention through spot and Non-Deliverable Forwards (NDFs) markets, a drop in oil prices, and the dovish revision of Federal Reserve (Fed) interest rate expectations.
At press time, the MCX Crude Oil contract expiring on October 19 is down 0.82% to near Rs. 8,600. Currencies from economies such as India, which rely heavily on oil imports to meet their energy needs, get some relief when oil prices begin correcting.
Oil Prices Drop Amid Increase in Flows from Saudi Arabia
Analysts at Deutsche Bank note that the earlier surge in Brent was tempered after “Saudi Arabia has restored about half the flows through its East-West pipeline.” Goldman Sachs also said in a note that it estimates Persian Gulf oil exports, including dark exports, to have recovered to their 2025 average after doubling in September.
However, experts also question the correction in oil prices and warn of upside risks even beyond 2026, citing dashed hopes of near-term United States (US)-Iran diplomacy. Deutsche Bank argues that persistent “scepticism about the Strait of Hormuz reopening any time soon has led investors to price a longer period of high prices into next year.”
Meanwhile, a report from Axios has shown that efforts this week by Qatari mediators to broker a diplomatic breakthrough between the US and Iran have made little progress, with neither side willing to budge. Such a scenario could allow oil prices to resume their upside.
Highest Single-Day FII Selling in Four Months
On Tuesday, overseas investors sold shares worth 99.8 billion rupees ($1.04 billion) on a net basis, marking their biggest outflow in about four months, according to Reuters. Selling pressure by Foreign Institutional Investors (FIIs) in the Indian equity market could renew concerns over Foreign Exchange (Forex) reserves, even after the RBI has significantly buffed up forex receipts through the Foreign Currency Non-Residents (FCNR) window.
US PCE Inflation Data Awaited
Later in the day, investors will pay close attention to the US Personal Consumption Expenditures (PCE) Price Index data for August, to be published at 12:30 GMT. The core PCE inflation — the Fed’s preferred inflation gauge — is expected to have remained steady at 3.3% Year-on-Year (YoY), with monthly figures growing at a faster pace of 0.3% against the previous reading of 0.2%. The data is expected to have a significant influence on Fed interest rate expectations.
Financial markets have trimmed hawkish Fed bets as New York Fed Bank President John Williams has ruled out the urgency of another interest rate hike. The CME FedWatch tool shows that the odds of the Fed delivering an interest rate hike in October have diminished to 44.8% from 70.9% seen on Monday.
Williams Tempers Post-Hike Urgency but Keeps Fed Firmly Hawkish
Fed’s Williams delivered a moderately hawkish message, with an FXS Speechtracker score of 6.4, slightly above the 6.2 historical average, signaling a tone that is firm but not escalating. The emphasis on “no need for urgency” after the latest rate hike, coupled with data-dependent guidance and the conditional prospect of one further hike this year, points to a cautious continuation of tightening rather than an aggressive push. Strong US economic momentum, persistent inflation risks including AI-related investment pressures, and a long glide path back to the 2% target reinforce a narrative of sustained restrictive policy.
The FXS Fed Sentiment Index fell by 1.43 points to 144.29, indicating a modest pullback in perceived hawkishness following the speech. Despite the decline, the index remains deep in hawkish territory above 100, underscoring that the Fed stance is still clearly restrictive even as the immediate urgency for additional rapid tightening is toned down.
In the September policy meeting, the Fed raised key rates by 25 basis points (bps) to the 3.75%–4.00% range. The major trigger for Fed interest rate projections later this week will be the Nonfarm Payrolls (NFP) data for September, due on Friday.
USD/INR Technical Analysis
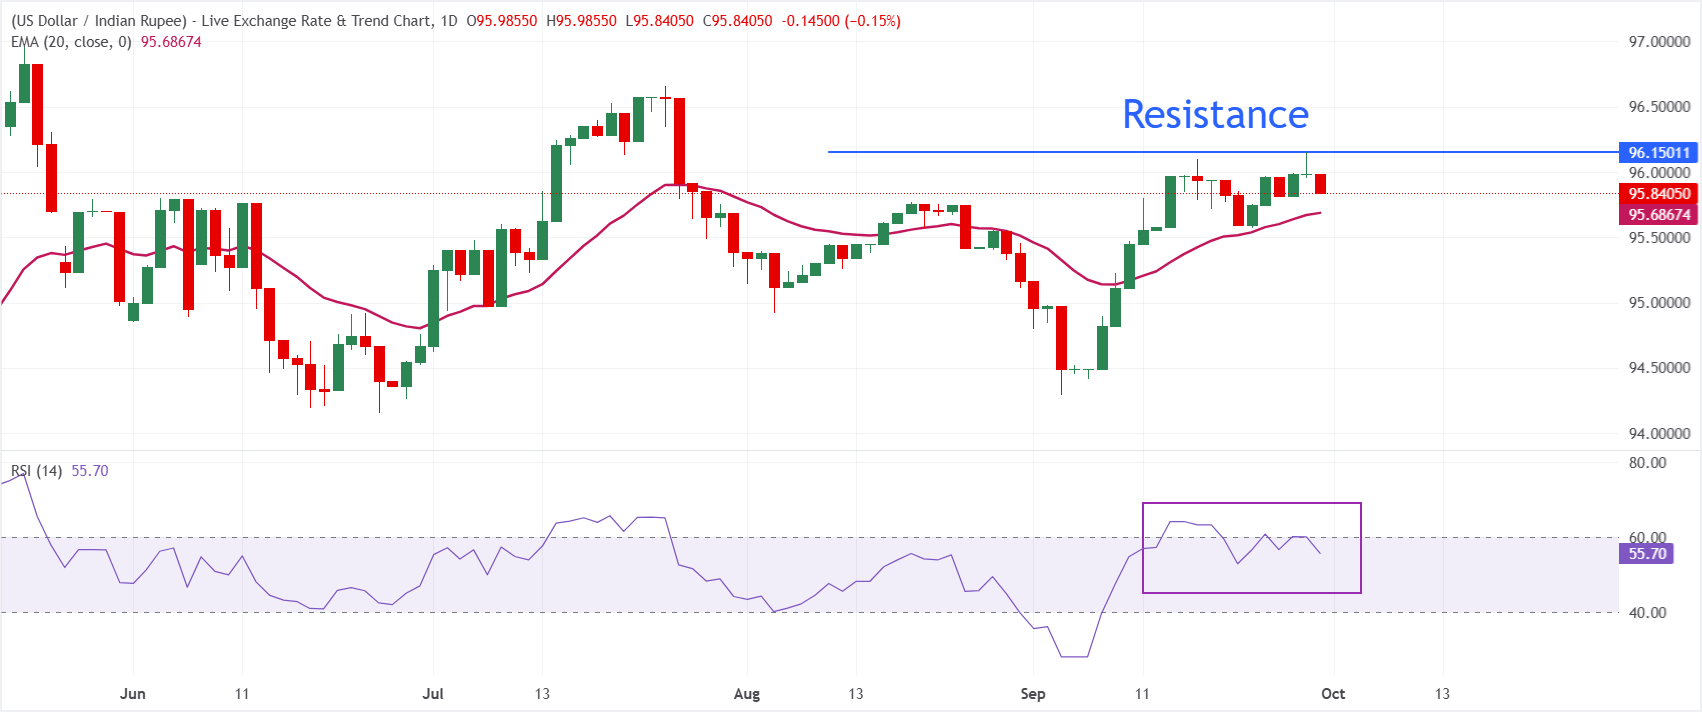
In the daily chart, USD/INR trades at 95.84, holding above the 20-period exponential moving average (EMA) at 95.68, which underpins a mildly bullish near-term bias. The pair has been grinding higher over recent sessions, and the Relative Strength Index (RSI) at 55.7 stays in neutral-to-positive territory, suggesting room for the uptrend to extend while dips remain supported by the nearby EMA.
On the downside, initial support is located at the 20-period EMA around 95.70, where buyers are likely to defend the prevailing uptrend on any pullback. Looking up, the September 29 high at 96.15 is the immediate hurdle for the pair; above that, the pair could attempt to revisit the all-time high near 97.00.
(The technical analysis in this article was written with the help of an AI tool. Know more.)