Hello fellow traders. In this technical article, we take a quick look at the Elliott Wave charts of IWM (iShares Russell 2000 ETF) published in the members area of the website. The ETF recently completed a Double Three pullback and found buyers precisely at the equal legs area as expected. The following sections break down the Elliott Wave structure in detail and explain the setup.
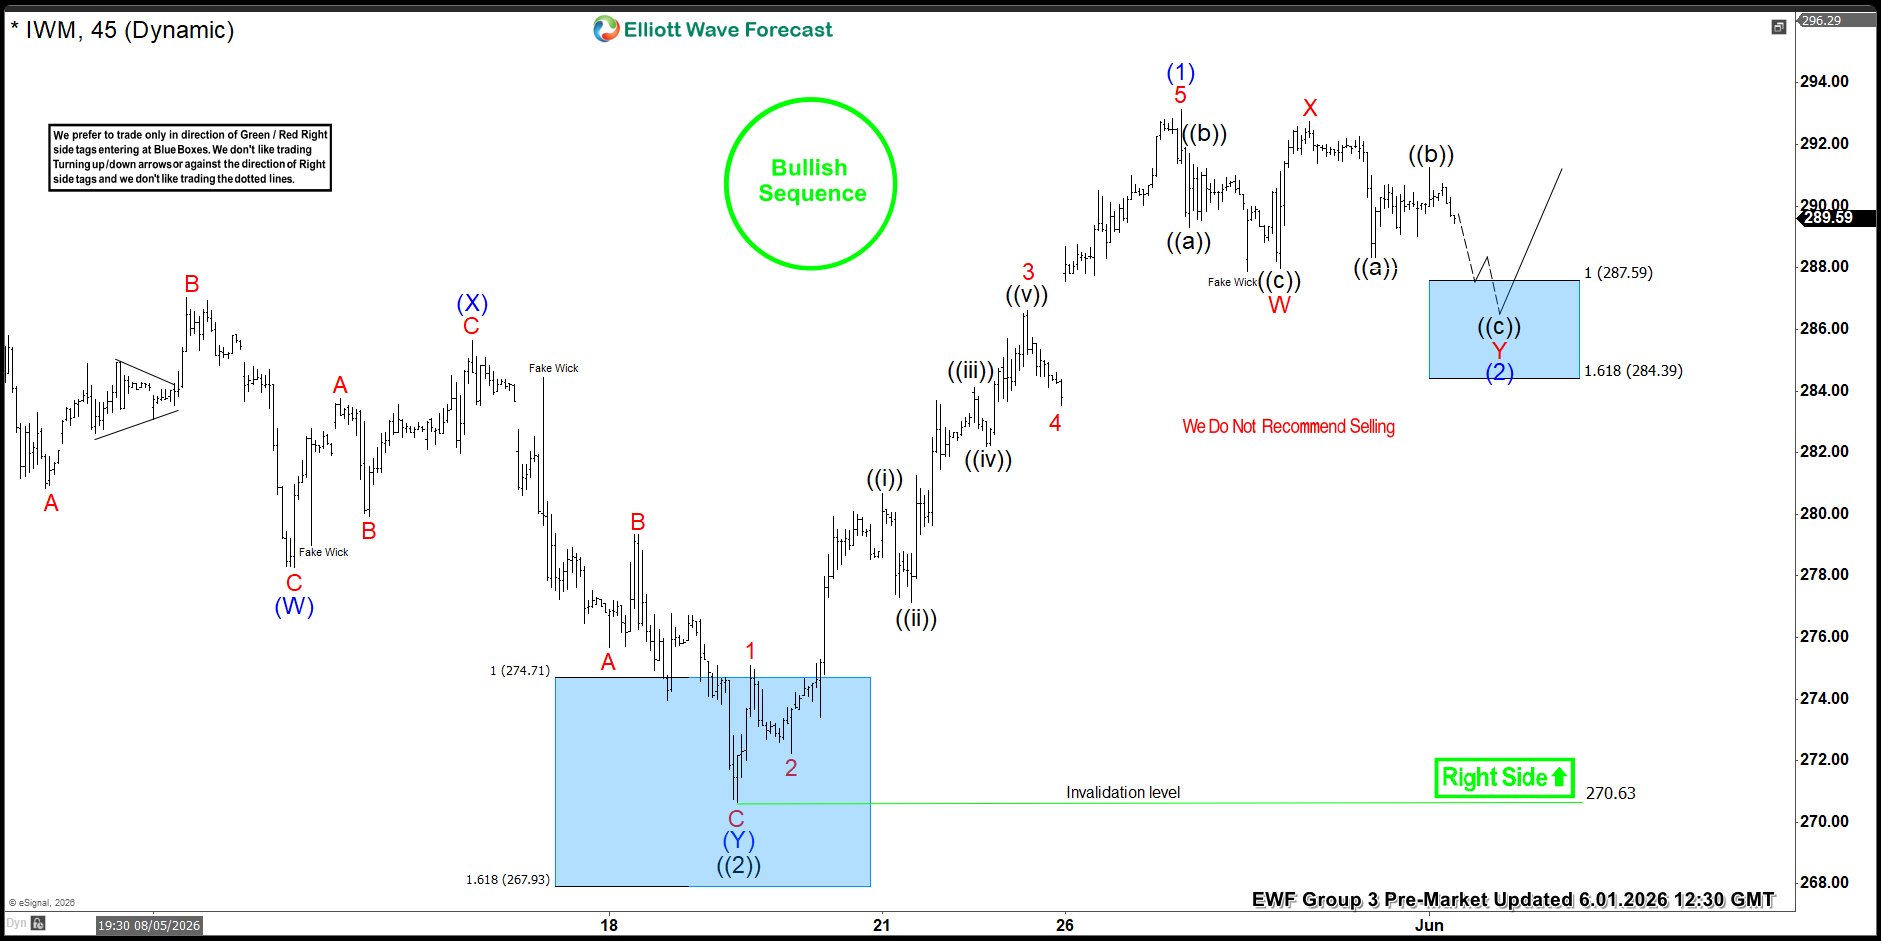
IWM Elliott Wave 1-Hour Chart - June 1, 2026
The ETF is forming a 3-wave pullback, unfolding as a Double Three pattern. The structure suggested more weakness toward the equal legs area at 287.59–284.39. A minimum three-wave bounce was expected from the Blue Box area. Once price reaches the 50% Fibonacci retracement against the X red connector, the plan is to make the position risk-free by moving the stop loss to breakeven and booking partial profits.

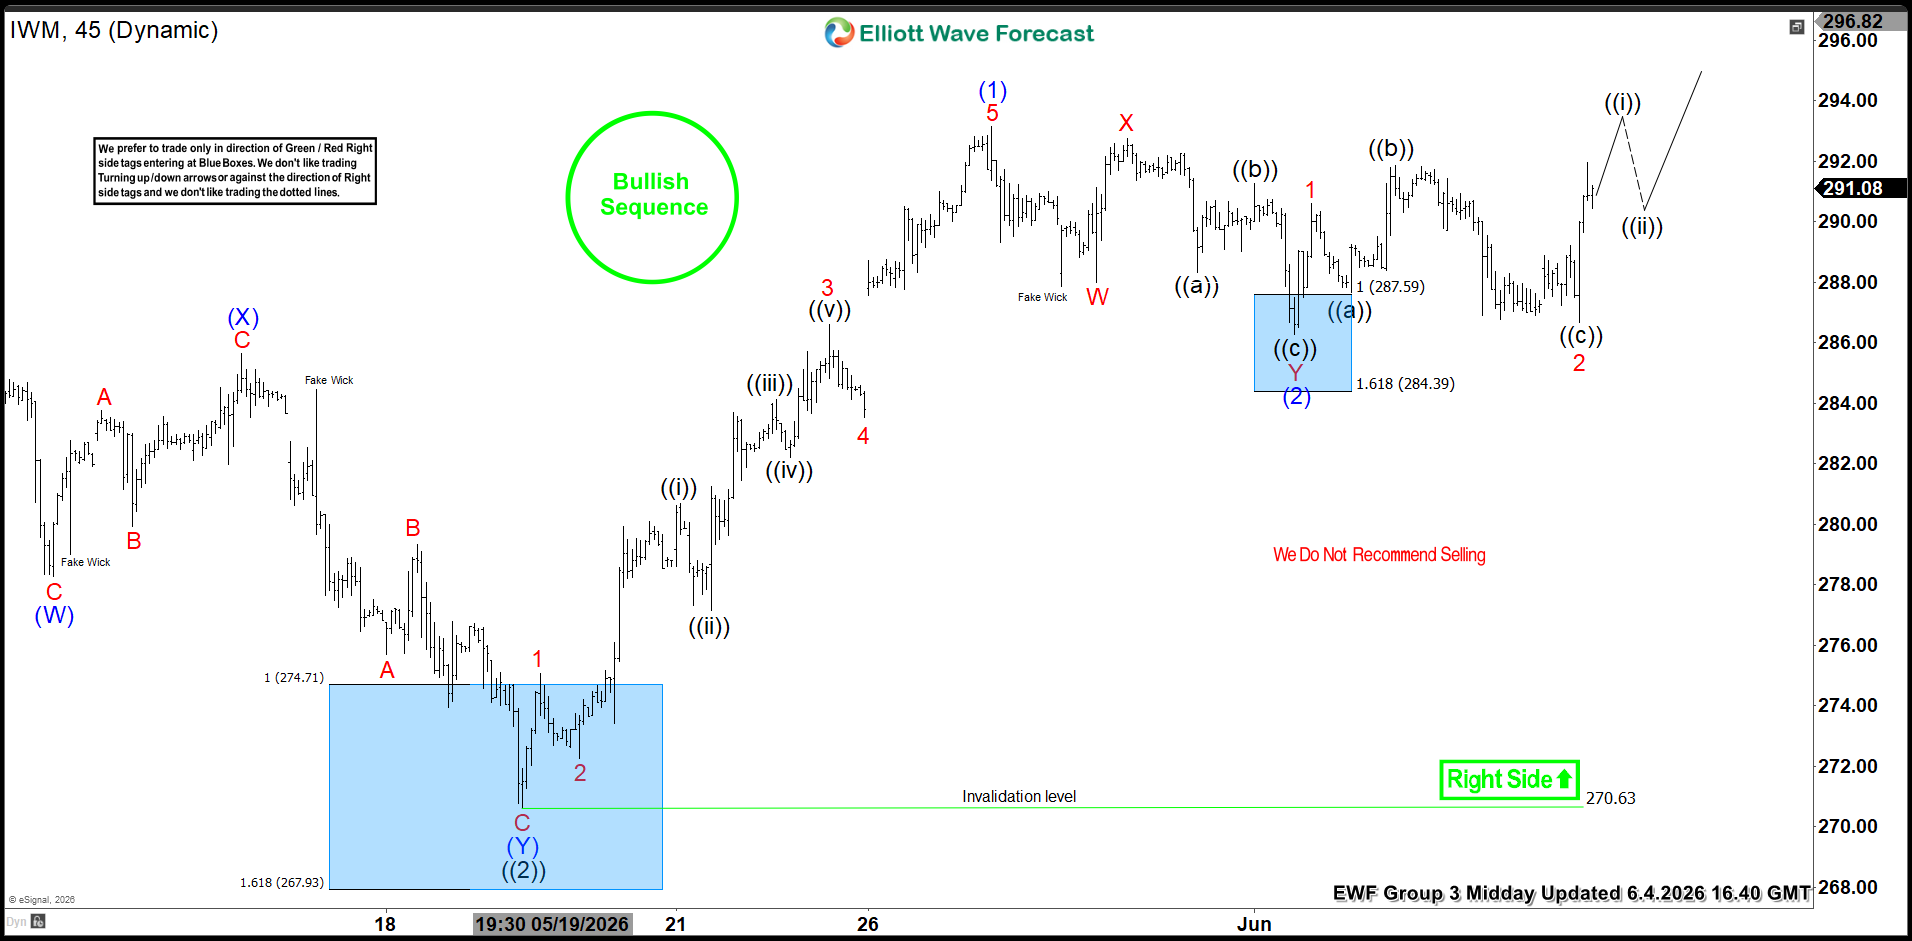
IWM Elliott Wave 1-Hour Chart - June 4, 2026
The ETF completed the correction above the invalidation level and made a decent reaction higher from the buying zone. As long as price holds above the 286.34 low, further upside remains likely. However, a break below the 286.34 low would open the way for additional downside within the wave (2) correction.