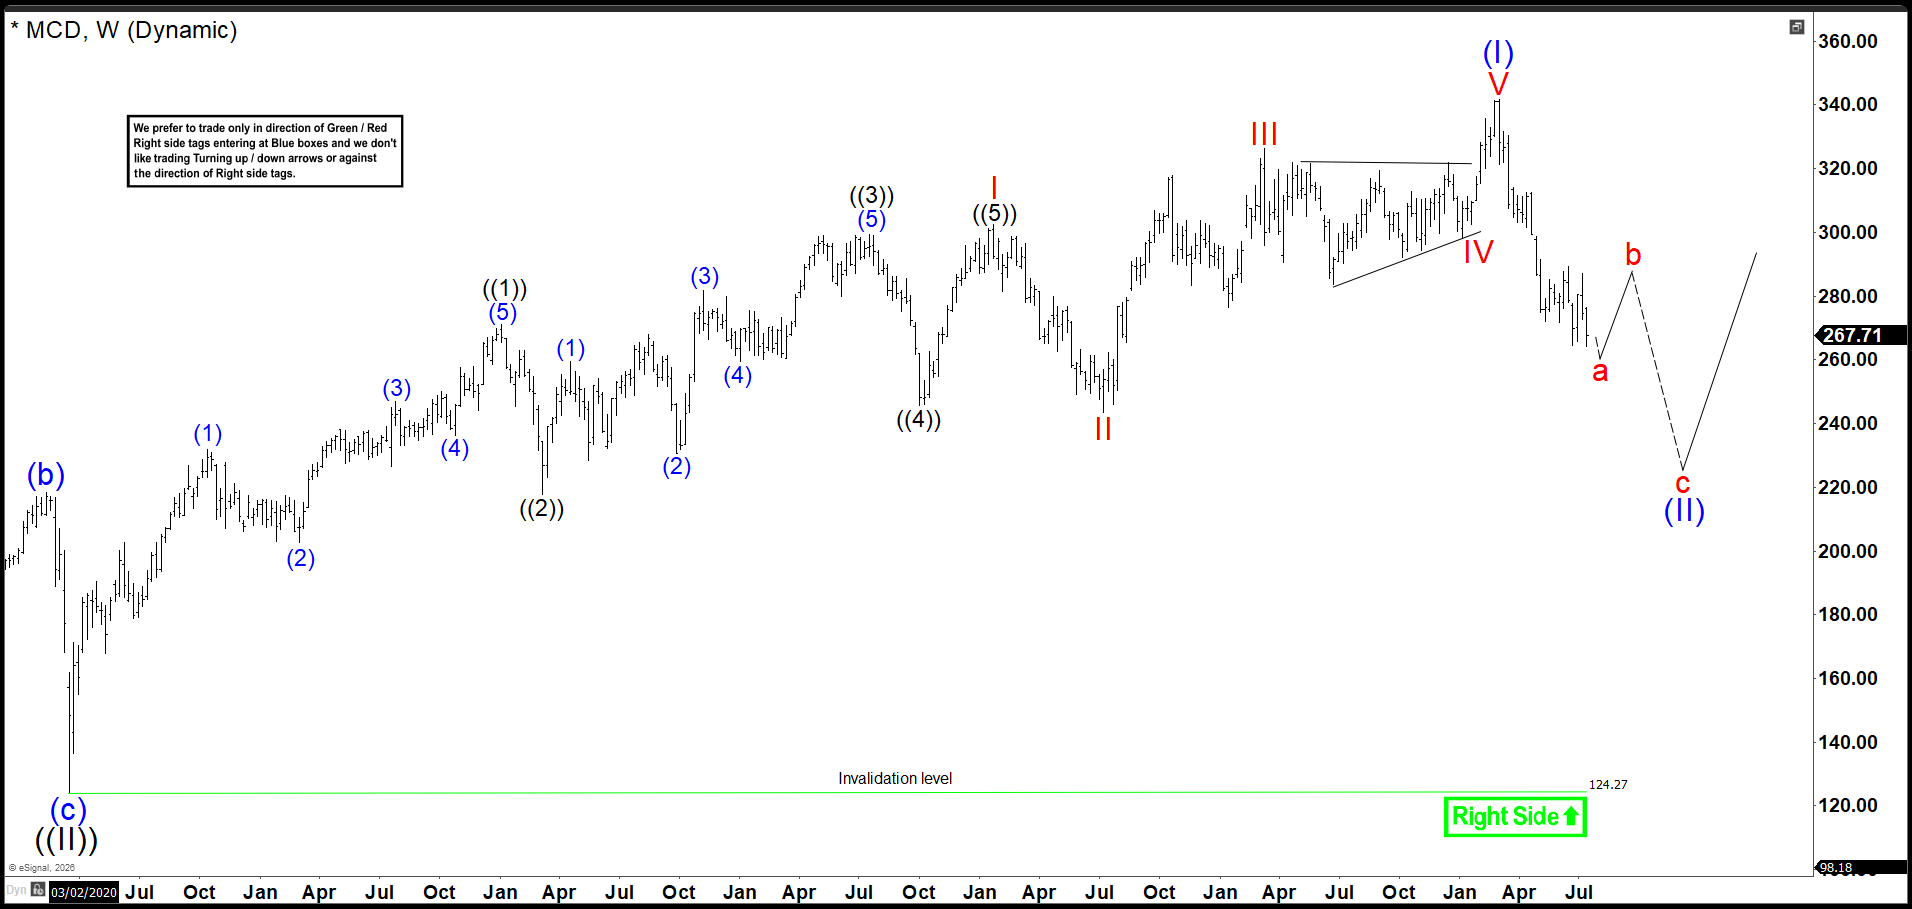
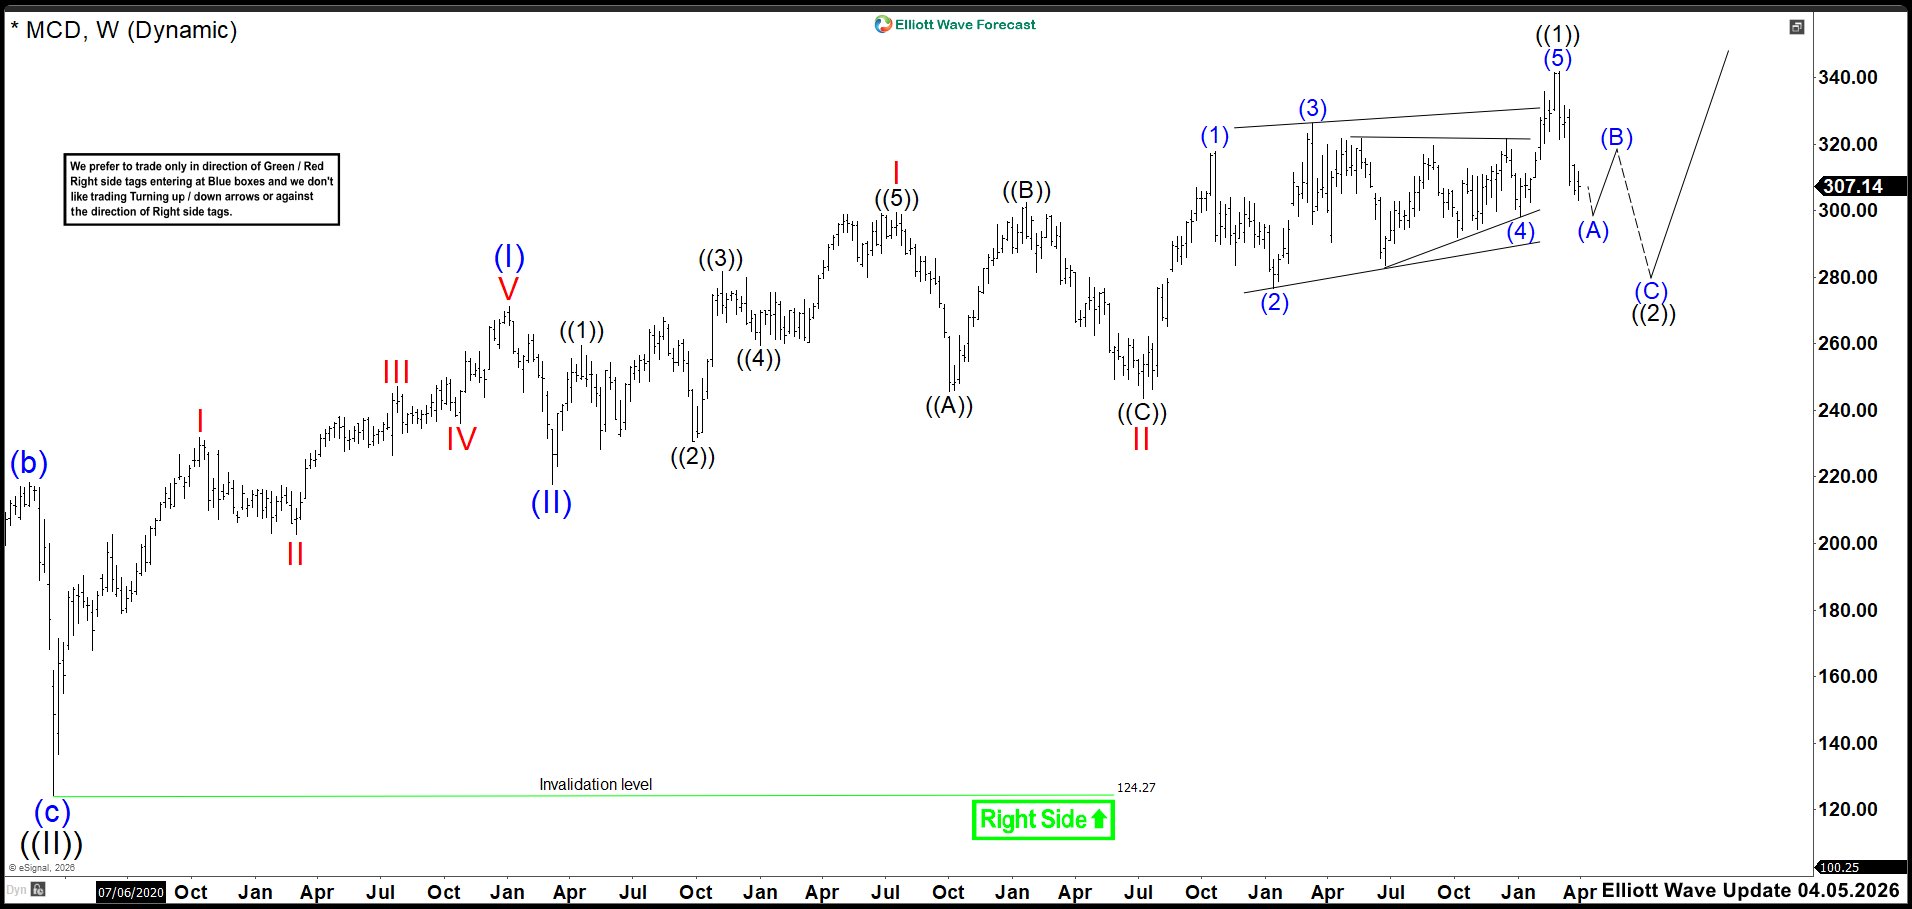
MCD looks set to correct the full advance that began in 2020. Price action already signals a developing Wave (II) retracement. The structure shows a clear break in momentum, confirming pressure on the larger cycle. Technically, MCD holds initial support near $245 while it stays below the 50-day average.
Looking ahead, Wave (II) should target the key Fibonacci retracement zones of the 2020 cycle. The bullish trend remains valid while the 2020 origin stays intact. Traders expect a multi-month pullback before Wave (III) resumes. A sustained drop under $245 would strengthen the Wave (II) outlook.
Elliott Wave Outlook: McDonald’s MCD Weekly Chart April 2026
Elliott Wave Principle Behind the Market Structure
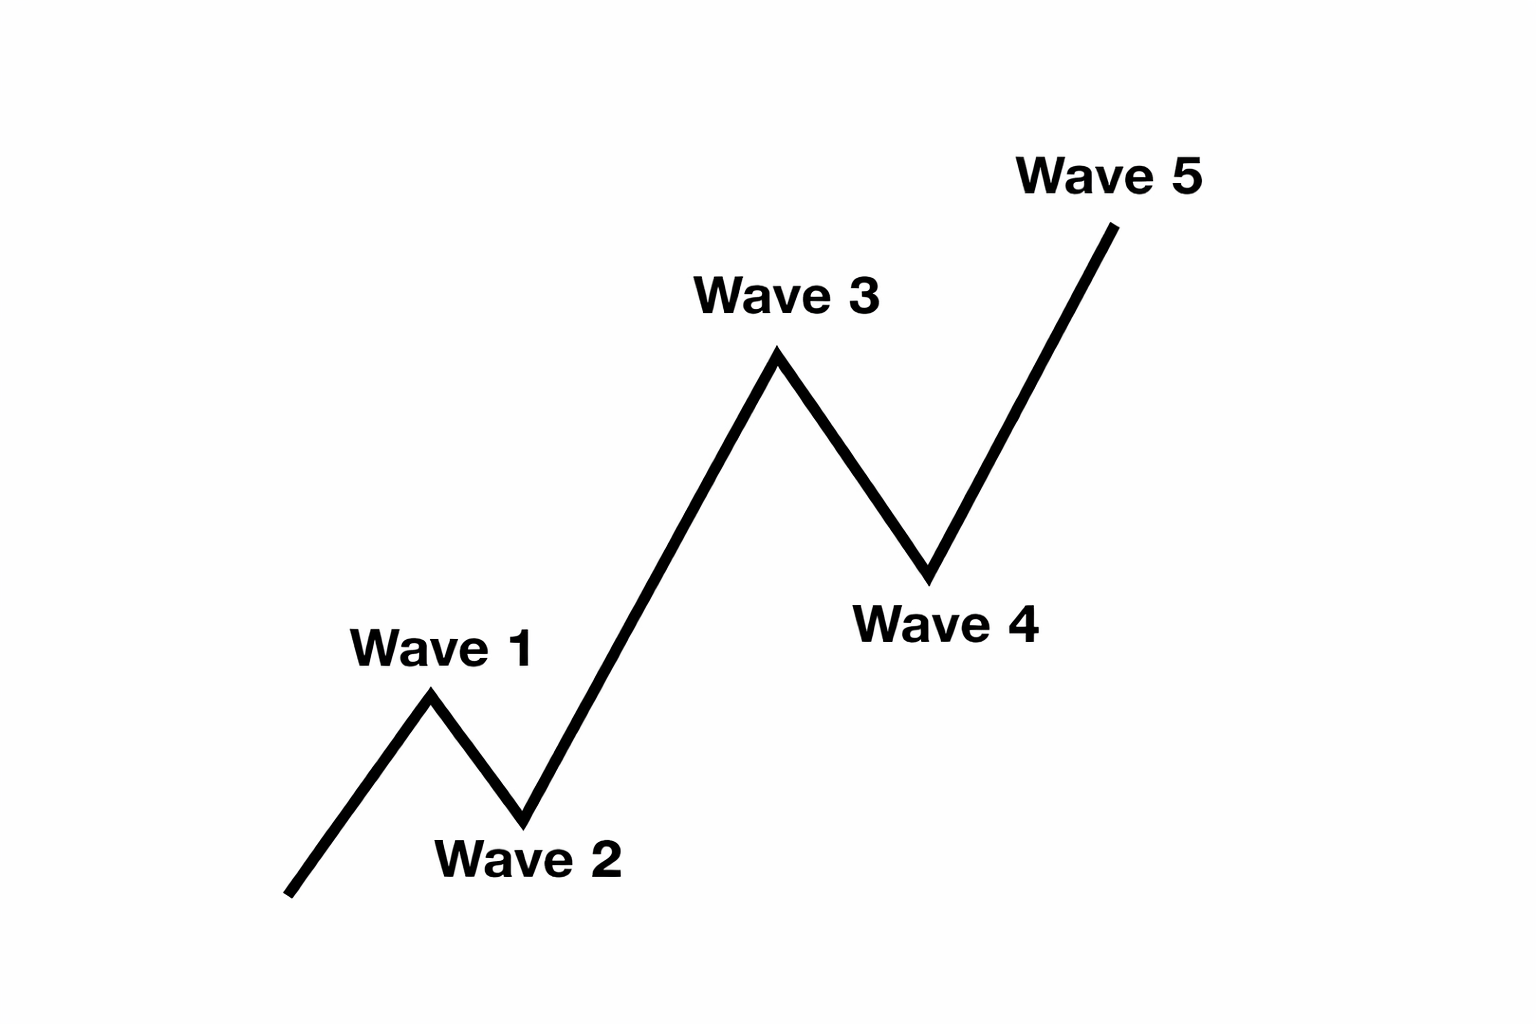
Impulse
An impulse is a clean 5-wave pattern that drives the trend forward.
- Waves 1–3–5 are strong and directional.
- No overlap between waves 1 and 4.
- Wave 3 is usually the strongest.
- Structure is clear, with increasing momentum.
Elliott Wave Outlook: McDonald’s MCD Weekly Chart July 2026
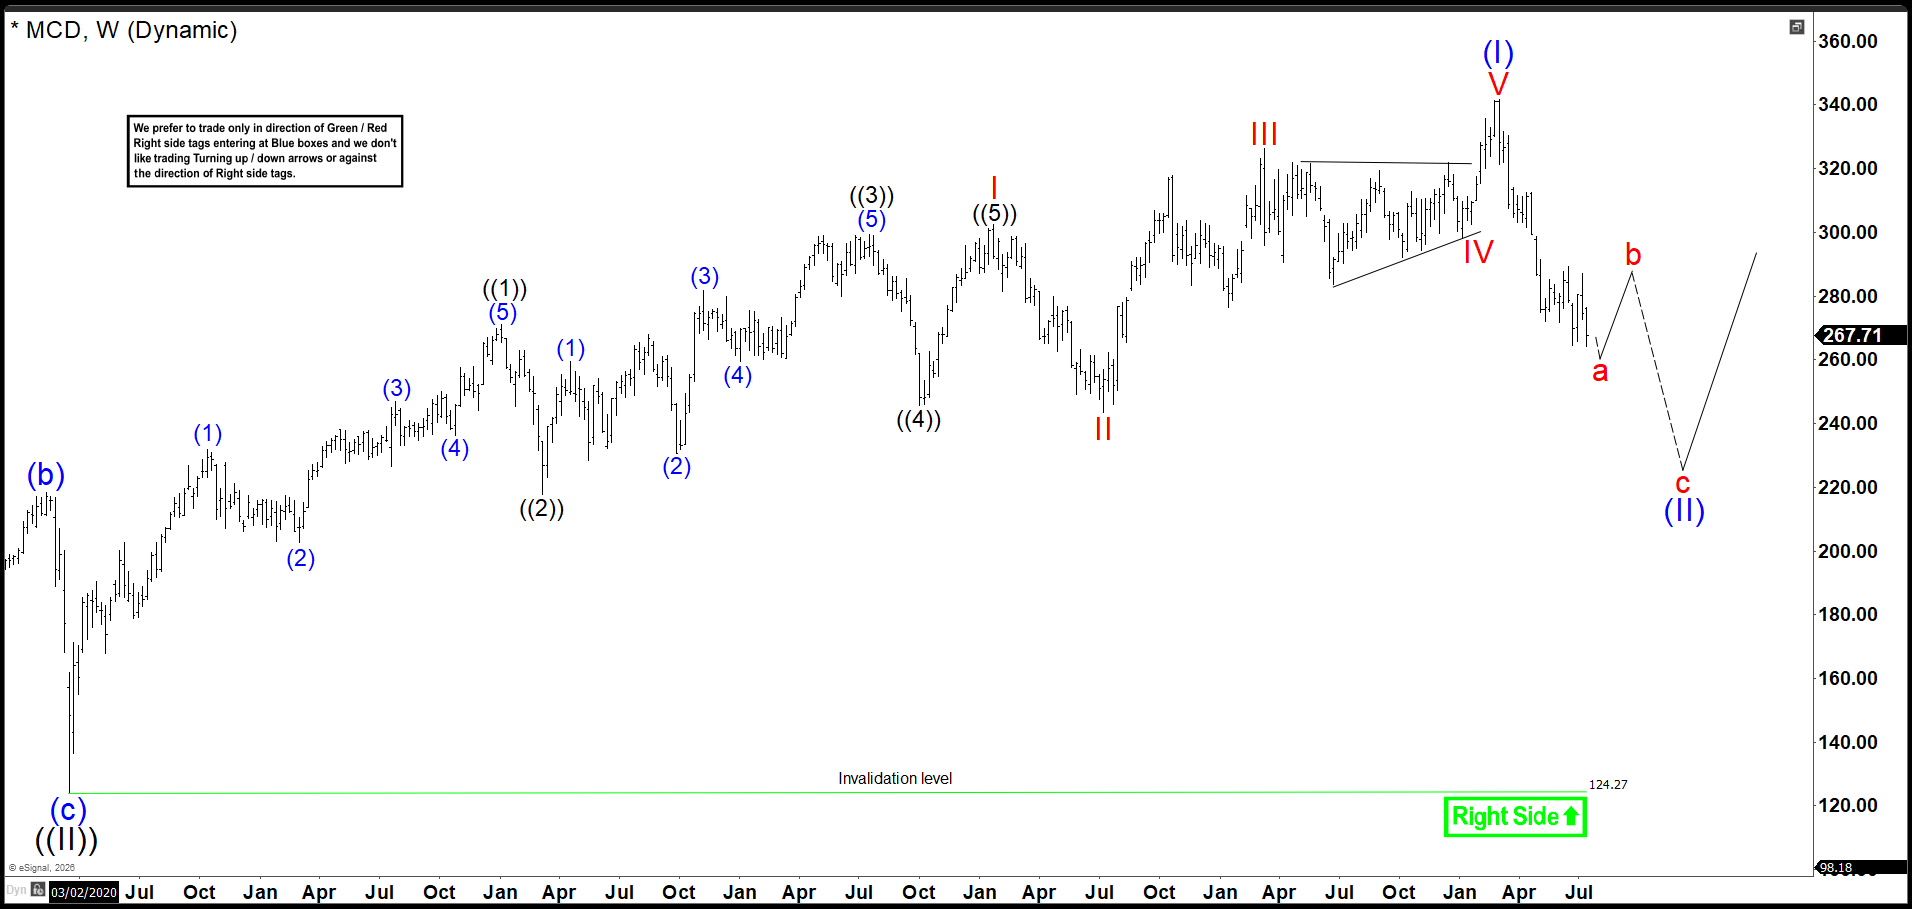
The latest update shows the decline keeps extending, suggesting MCD may be correcting the full cycle from the 2020 low. The triple nest has been removed and a leading diagonal is now labeled as wave (I). A rebound is expected soon, with the market currently trading in wave b. That rebound should fail and allow wave c of (II) to continue lower.
This correction could reach the 259.00–207.56 area. A rebound from that zone would confirm the broader bullish continuation and set the stage for the next impulsive advance.