In this technical article, we examine the Elliott Wave charts of Russell 2000 Futures ($RTY_F), published in the members’ area of our website.
As our members know, we’ve identified several high-quality trading setups recently. Russell 2000 Futures delivered another one. RTY_F formed a clear three-wave decline from the peak and completed the correction precisely within the Equal Legs area. We presented this buying opportunity to members as a real-time trading setup.
Traders who missed the previous Russell setup were given another opportunity to enter the market. The sections below break down the Elliott Wave structure, trading setup, and upside target levels.
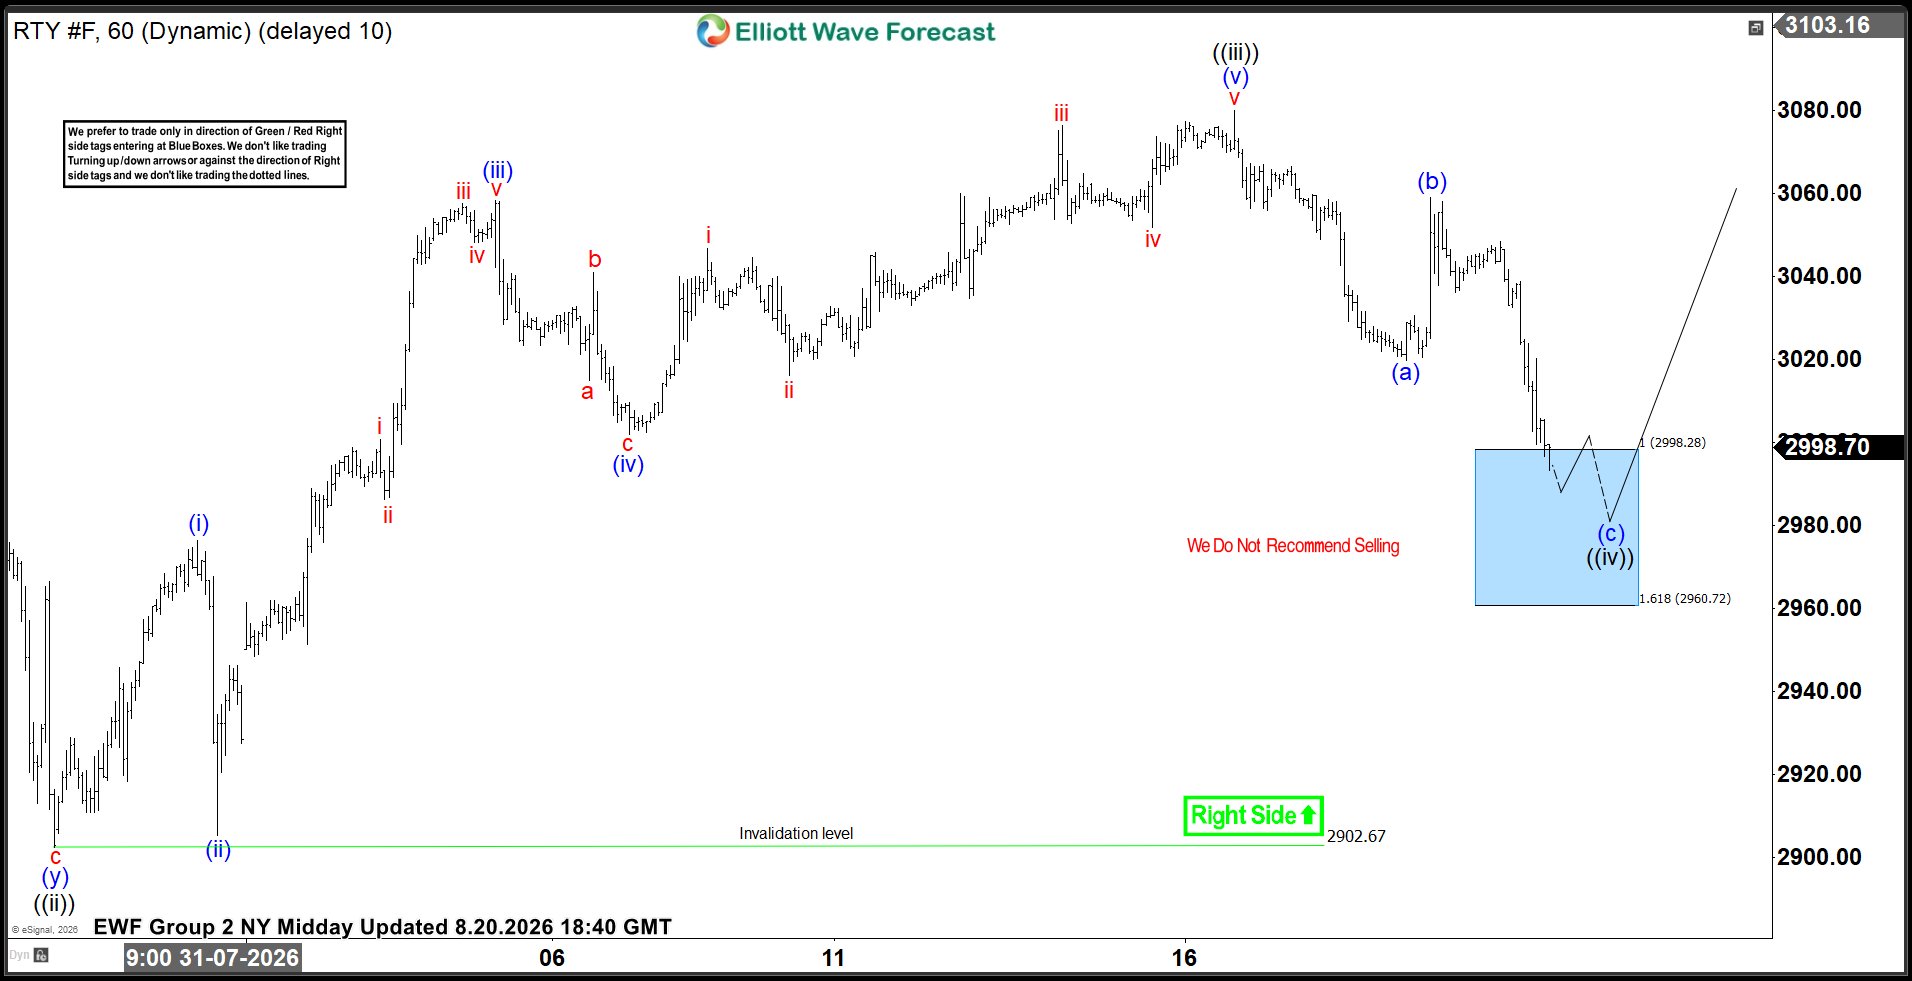
Russell Elliott Wave 1-Hour Chart — 08.20.2026
At the moment, Russell 2000 Futures is correcting the bullish cycle that began at the 2902.6 low. The decline from the recent peak is unfolding as a clear three-wave pullback, with price approaching the Blue Box buying zone at 2998.2–2960.7. Therefore, we do not recommend selling RTY_F into this area. Instead, we favor the long side and expect buyers to appear within the Blue Box. From there, Russell should ideally resume the rally toward new highs. Alternatively, we may see at least a three-wave bounce. In either case, once the bounce reaches the 50% Fibonacci retracement against the wave (b) blue high, we will make the long position risk-free by moving the stop loss to breakeven and securing partial profits.
Quick reminder on how to trade our charts:
- Red bearish stamp + Blue Box = Selling Setup
- Green bullish stamp + Blue Box = Buying Setup
- Charts with Black stamps are not tradable 🚫
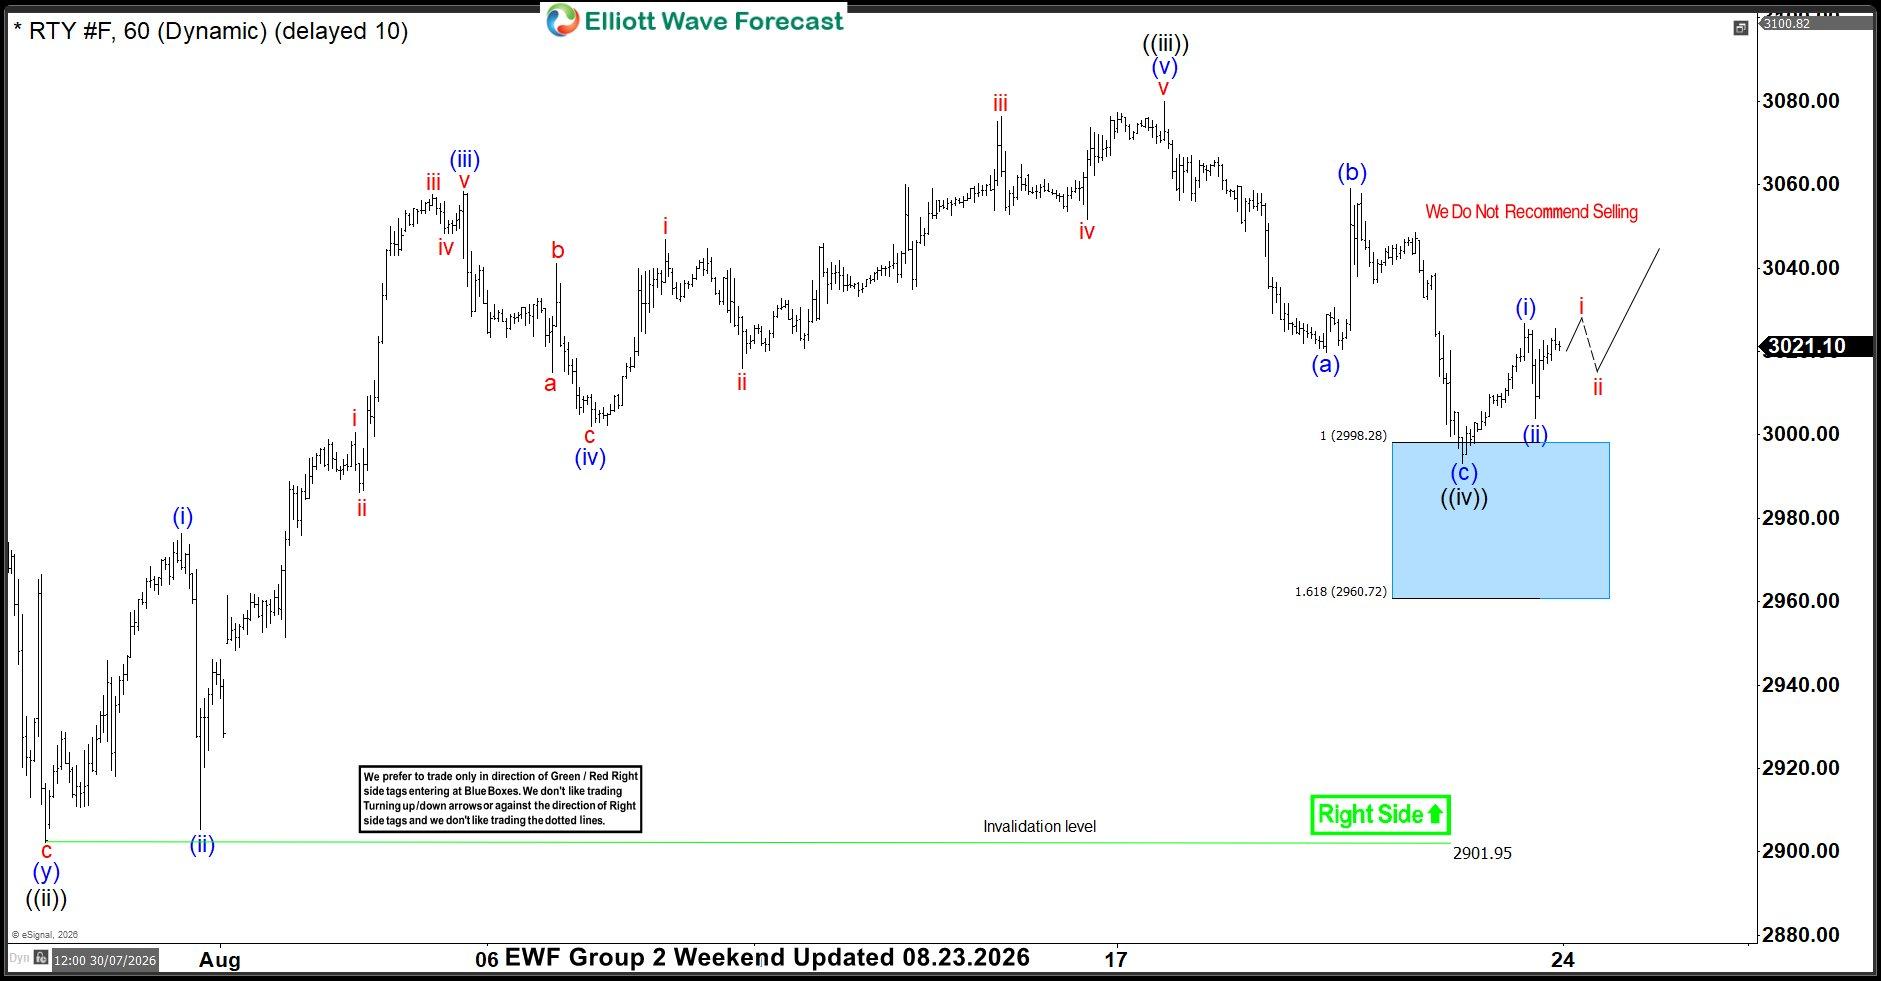
Russell Elliott Wave 1-Hour Chart — 08.23.2026
Russell found buyers precisely at the Equal Legs level and produced a reaction from the Blue Box area. As a result, all long positions taken from the buying zone should now be risk-free.
We count the correction as completed at the 2993.4 low, which is the key level supporting our bullish view. As long as price remains above that low, RTY_F may already be advancing in wave ((v)), targeting the 3100+ area. On the other hand, if the 2993.4 low is broken, the decline could extend into a seven-swing structure from the peak, which would provide another buying opportunity at lower levels.
The latest charts and updated target levels are available in the membership area. Keep in mind that the market is dynamic and the outlook may have shifted since publication. The best instruments to trade are those with incomplete bullish or bearish swings, listed in the Sequence Report, with top setups highlighted in the Live Trading Room. Member Chat Rooms are open 24 hours a day, Monday through Friday, providing ongoing expert guidance on market trends and Elliott Wave analysis throughout the trading week.