QuantumScape remains focused on commercializing its solid-state lithium-metal batteries while scaling production through its Eagle Line. The company also expanded industry validation through Volkswagen and a 2026 research agreement with Honda. However, QS still lacks commercial revenue, so execution and manufacturing progress remain the main investor concerns.
Analysts remain cautious, with a consensus Hold rating and an average 12-month target near $6.66. Targets range from $2.50 to $10, reflecting major disagreement about commercialization speed and future valuation. Through year-end, investors will watch production scaling, customer testing, and progress toward broader automotive commercialization. Strong execution could support a recovery, while delays could keep shares under pressure.
Elliott Wave Outlook: QuantumScape (QS) Weekly Chart — August 2026
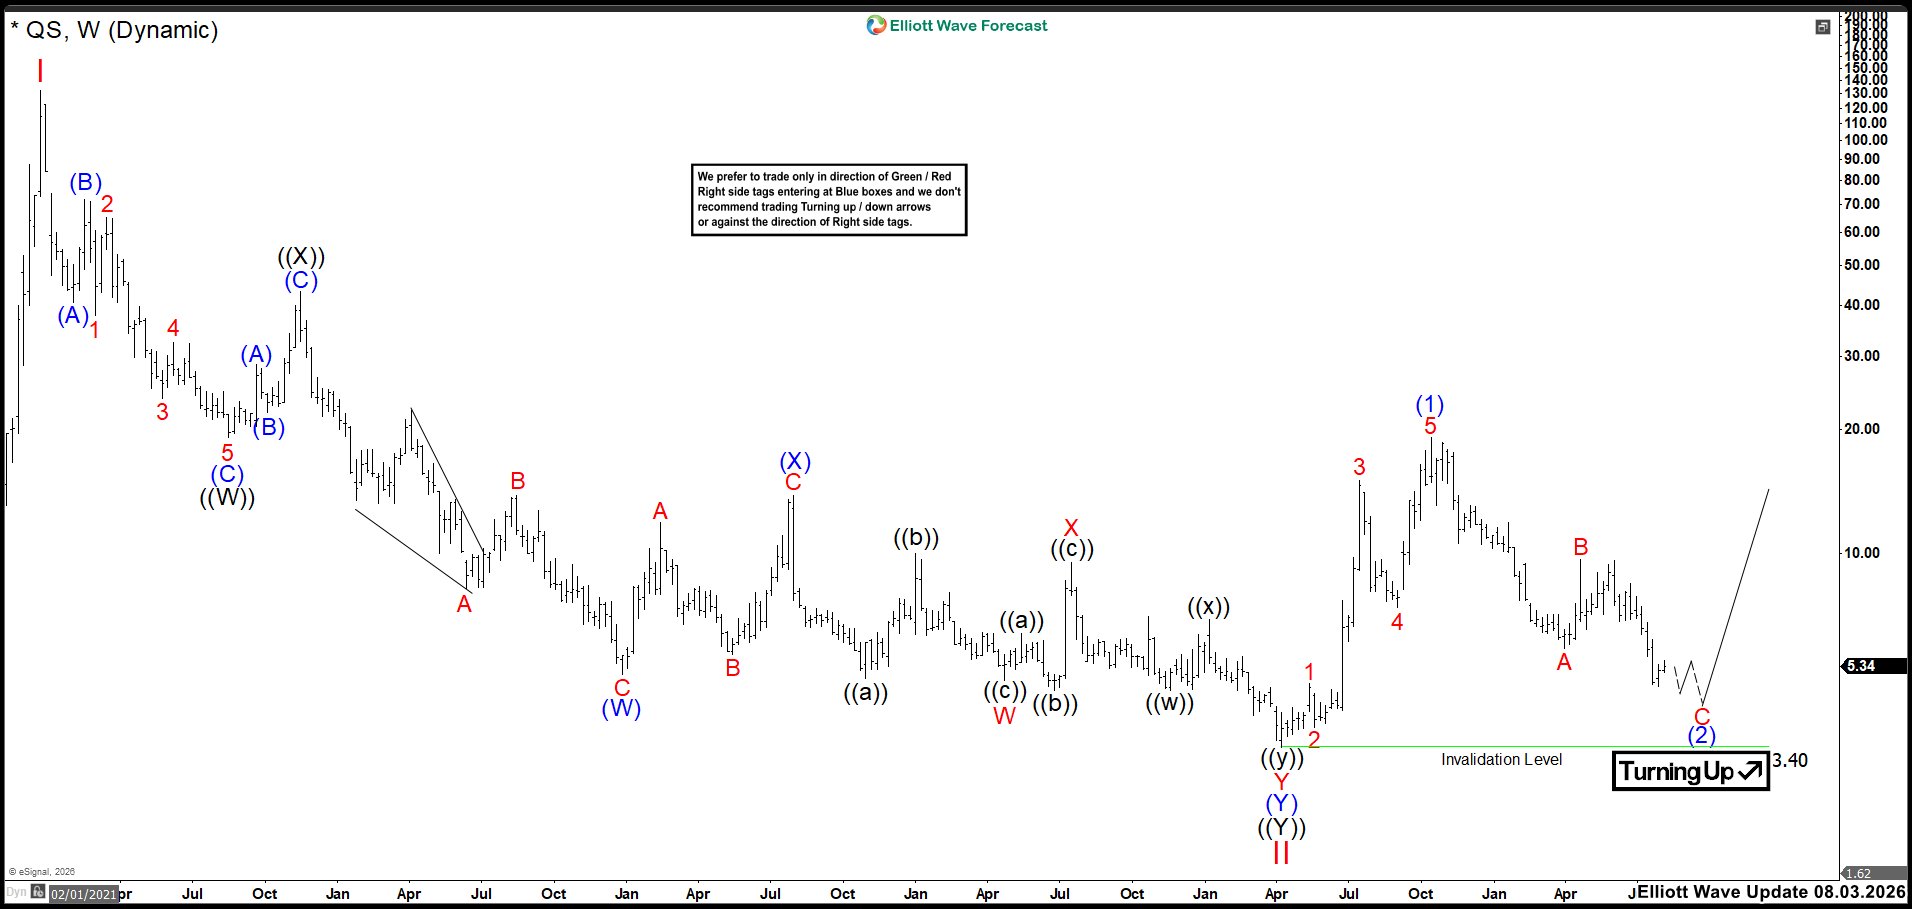
As shown on the chart, Wave B was expected to resist buying pressure and send the market lower. Price eventually reached the 5.03–3.60 zone, which was identified as a potential support area. However, the short-term bearish structure still looked incomplete at that time.
Two additional lows were expected to complete the Wave C impulse and form a cleaner bottom. In the worst-case scenario, one final low below 4.77 was also allowed before a bullish reversal. Once that structure completed, the next upward cycle was expected to begin.
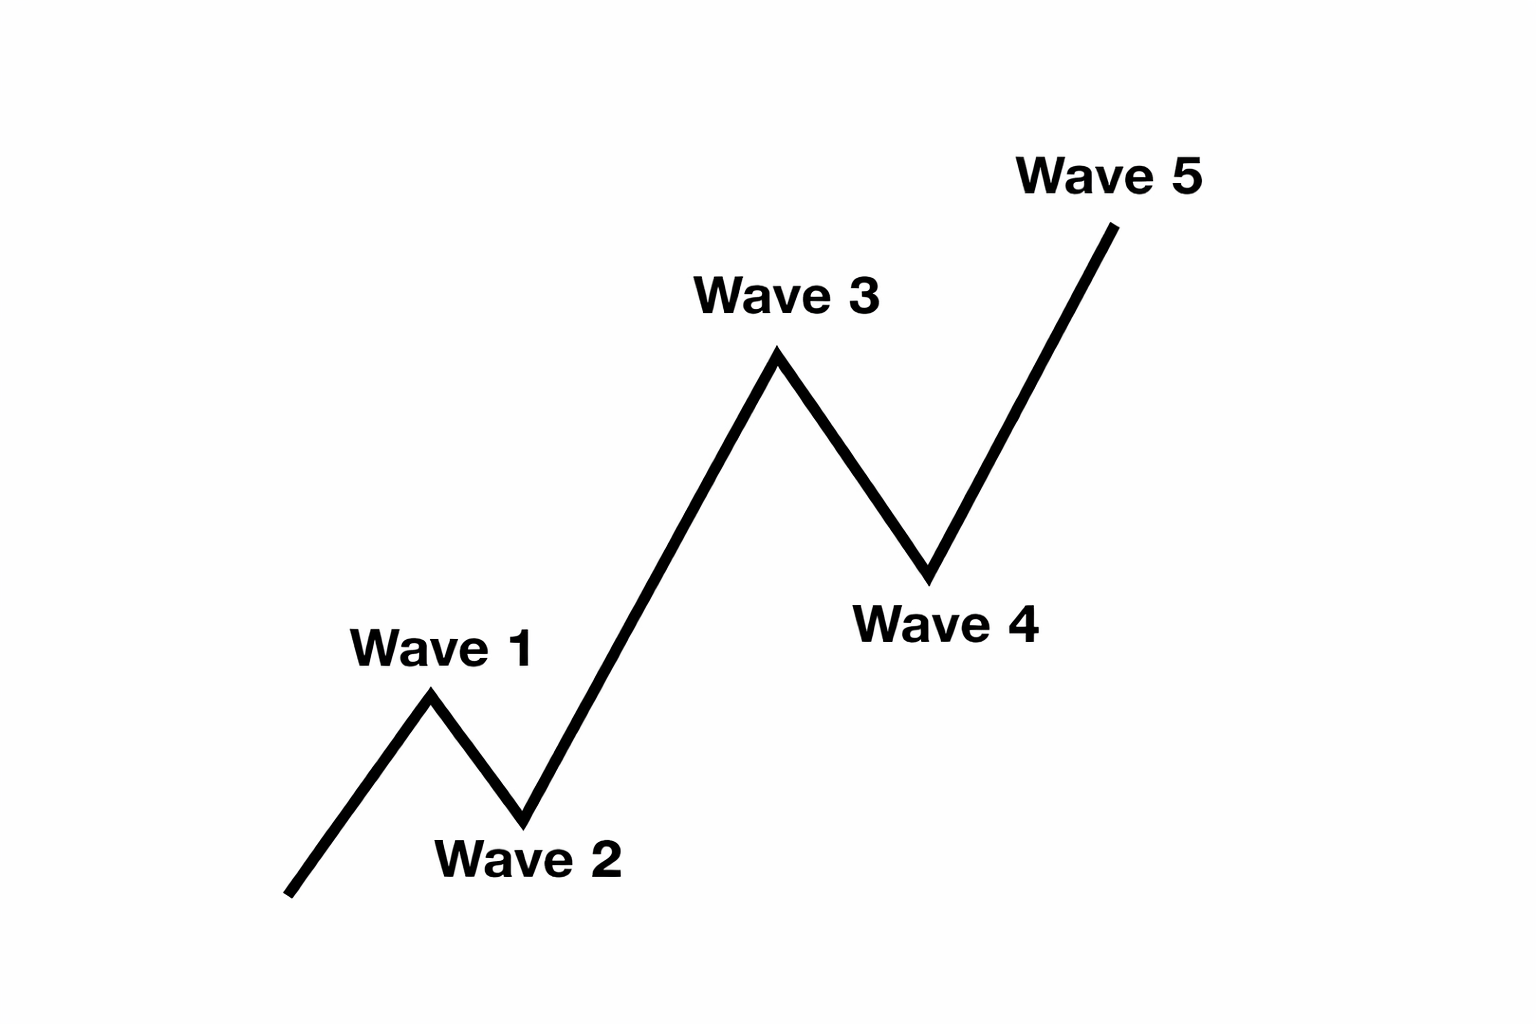
Elliott Wave Principle Behind the Market Structure
Impulse
An impulse is a clean 5-wave pattern that drives the trend forward.
- Waves 1–3–5 are strong and directional.
- No overlap between waves 1 and 4.
- Wave 3 is usually the strongest.
- Structure is clear, with increasing momentum.
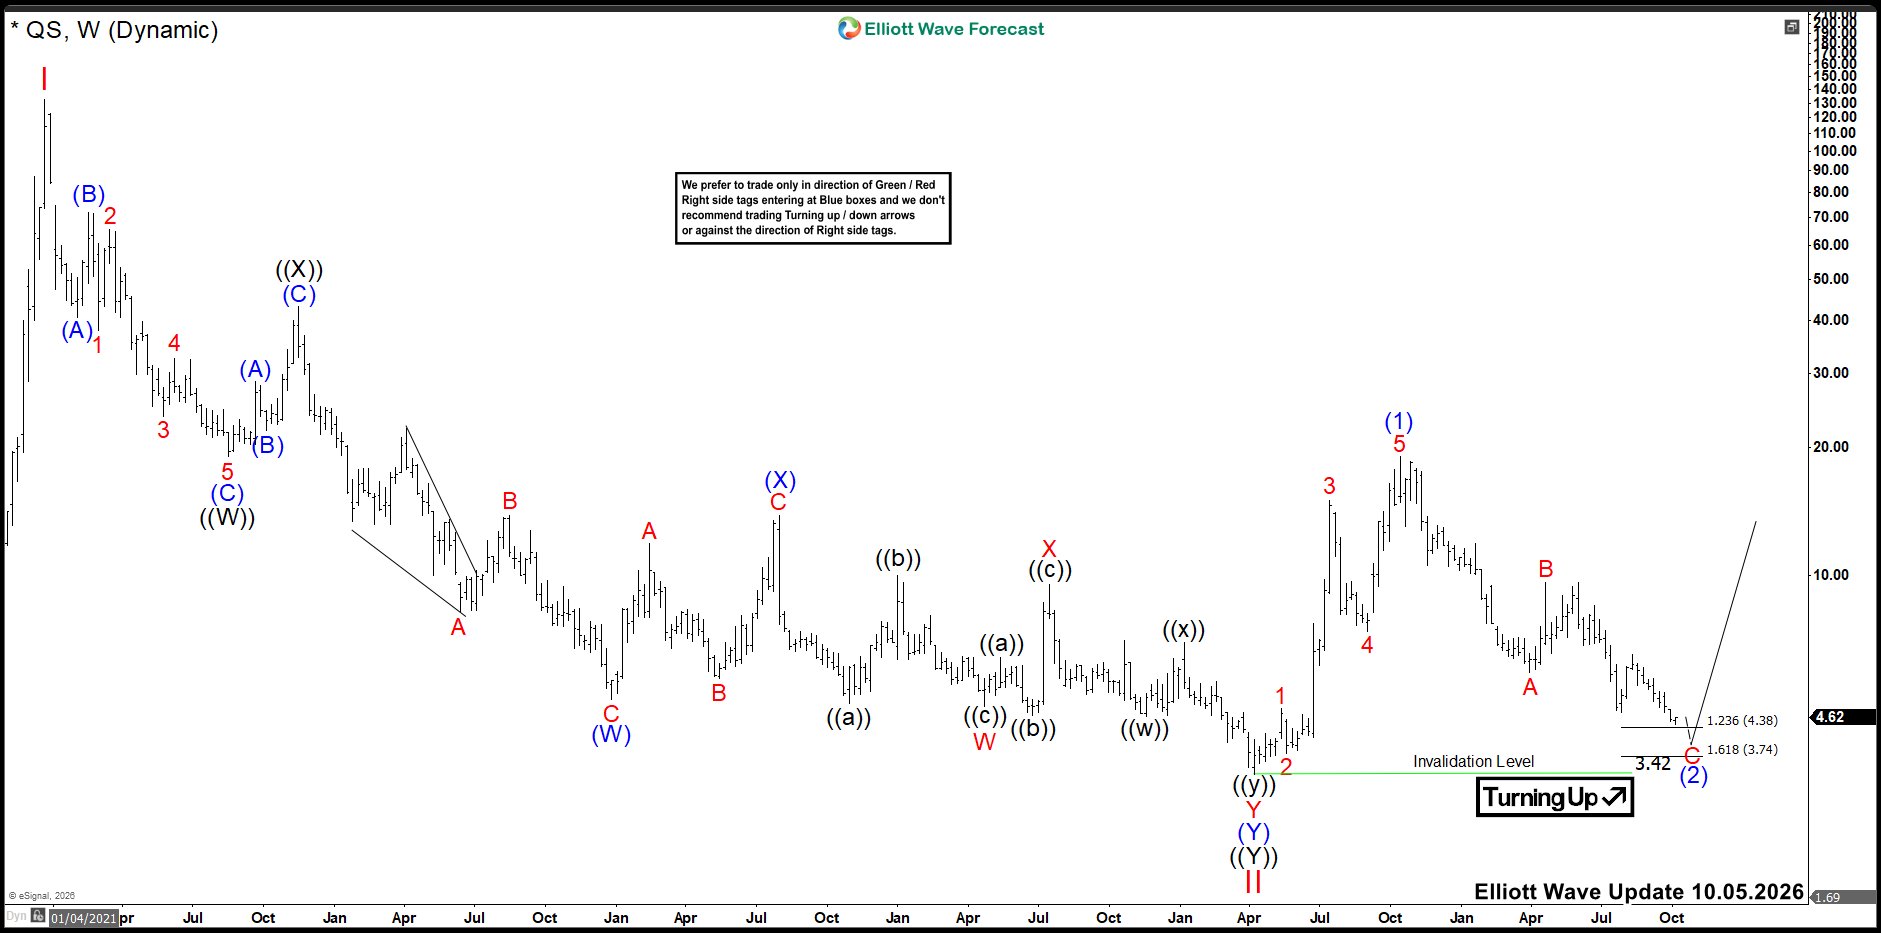
Elliott Wave Outlook: QuantumScape (QS) Weekly Chart — October 2026

QS remains in a long-term recovery structure after completing the major Wave II correction near the 2023 low. Since then, the stock rallied impulsively and completed wave (1) near the 20 area. Price has since turned lower and entered a corrective wave (2).
Currently, QS is approaching the key 4.38–3.74 Fibonacci support zone, which could complete wave C of (2). The broader bullish structure remains valid while price stays above the 3.42 invalidation level.
If buyers defend this support zone, QS could begin the next impulsive advance in wave (3). However, the market still needs to confirm a bottom, so the preferred approach is to watch for a bullish reaction rather than chase the current decline. A break below 3.42 would invalidate the immediate bullish setup and require a reassessment of the broader wave count.